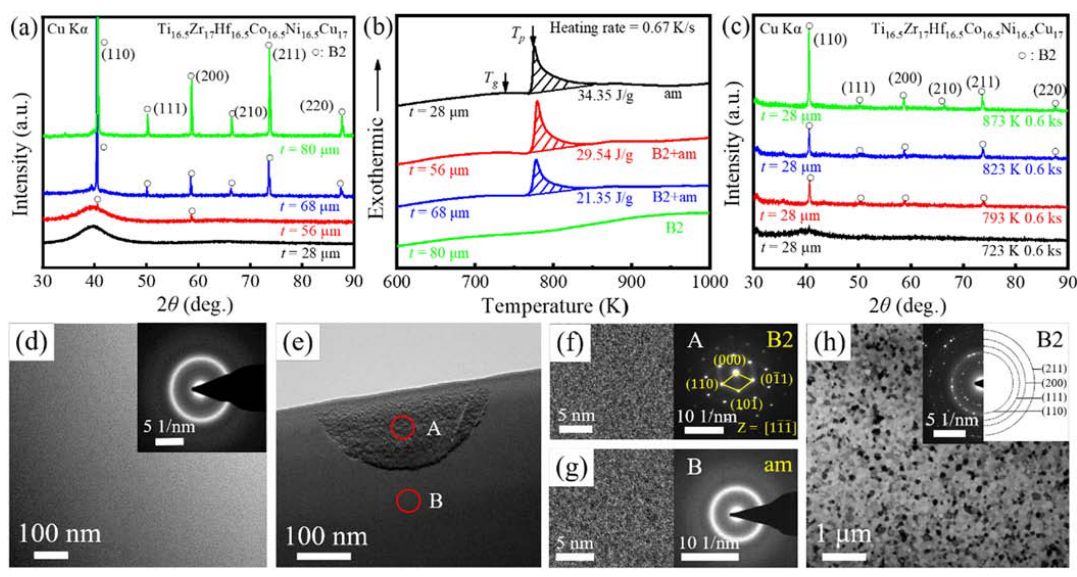
X-ray diffraction patterns (a) and DSC curves (b) of the as-spun alloy ribbons with thicknesses of 28, 56, 68, and 80 µm, respectively. (c) X-ray diffraction patterns of the 28 µm thick ribbons annealed at 723–873 K for 0.6 ks. Bright-field TEM images and selected-area electron diffraction patterns of the as-spun ribbons with thicknesses of 28 µm (d) and 65 µm (e-g) and the annealed 28 µm thick ribbon at 873 K for 0.6 ks (h).
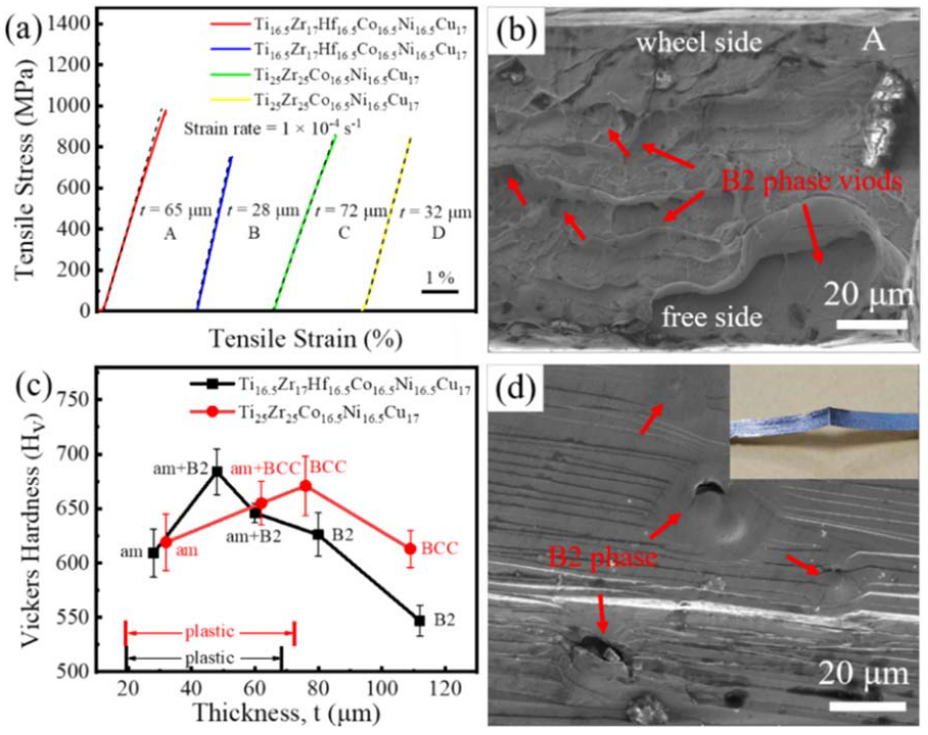
(a) Tensile stress-elongation curves of as-spun alloy ribbons with thicknesses of 65, 28, 72, and 32 µm for Ti16.5Zr17Hf16.5Co16.5Ni16.5Cu17 and Ti25Zr25Co16.5Ni16.5Cu17 alloys.(b) SEM image of the fracture surface of the 65 µm thicked ribbon after a tensile fracture. (c) Changes in structure, Vickers hardness, and bending plasticity with ribbon thickness.(d) SEM image of the bent outer surface region for the 48 µm thick ribbon.
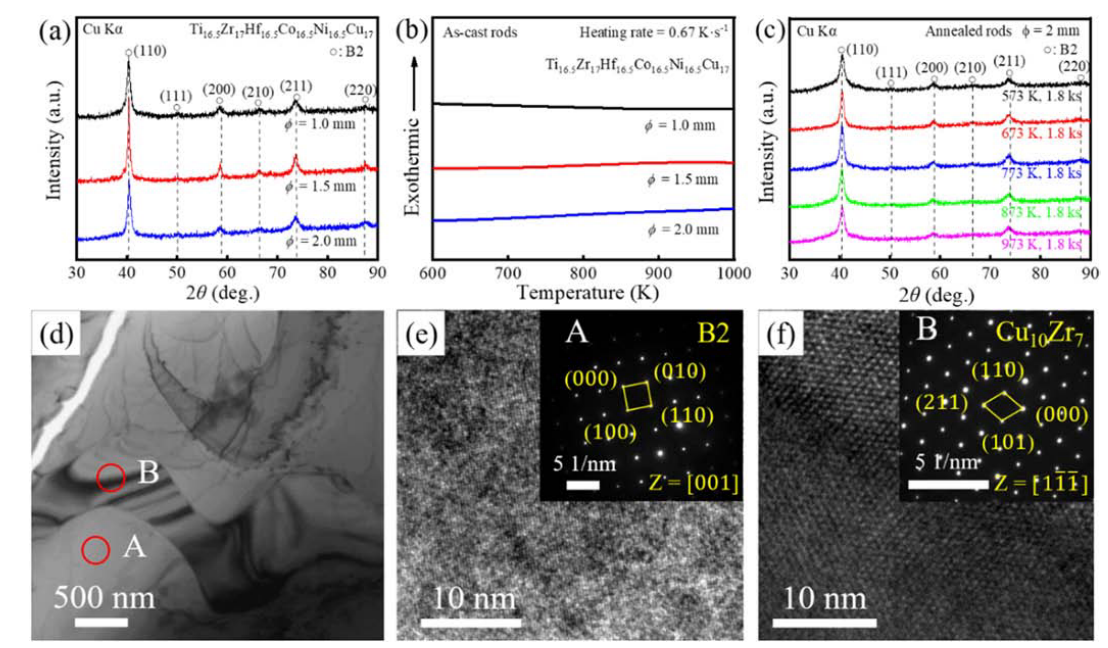
(a) X-ray diffraction patterns and (b) DSC curves of as-cast Ti16.5Zr17Hf16.5Co16.5Ni16.5Cu17 alloy rods with diameters of 1.0, 1.5, and 2.0 mm. (c) X-ray diffraction patterns of the alloy rods annealed at 573–973 K for 1.8 ks. (d) Bright-field TEM image of the as-cast alloy rod of 2 mm in diameter. High-resolution TEM images and nanobeam diffraction patterns of the matrix region (e) and the second phase region (f) are marked with A and B, respectively.
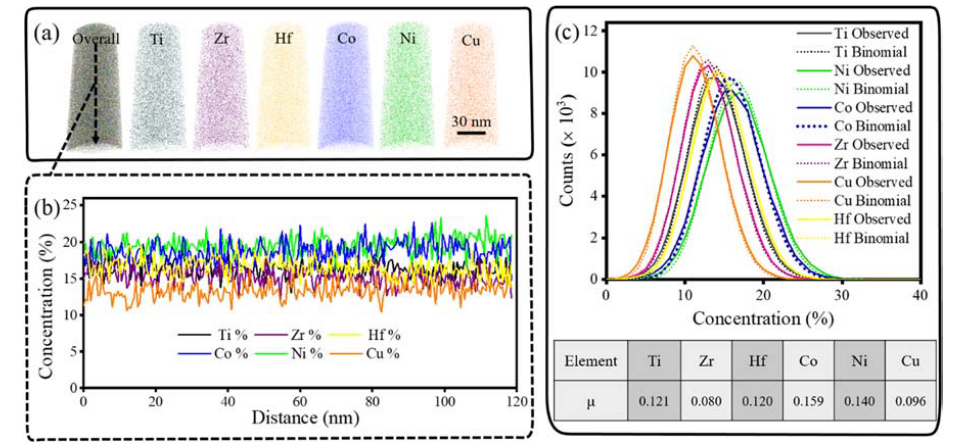
(a) 3D reconstruction map of an APT tip highlighting the nano-precipitates. (b) 1D compositional profiles show the compositional changes across a selected route marked with the black arrow shown in the inset. (c) Frequency distribution analysis shows the random distribution of the elements.
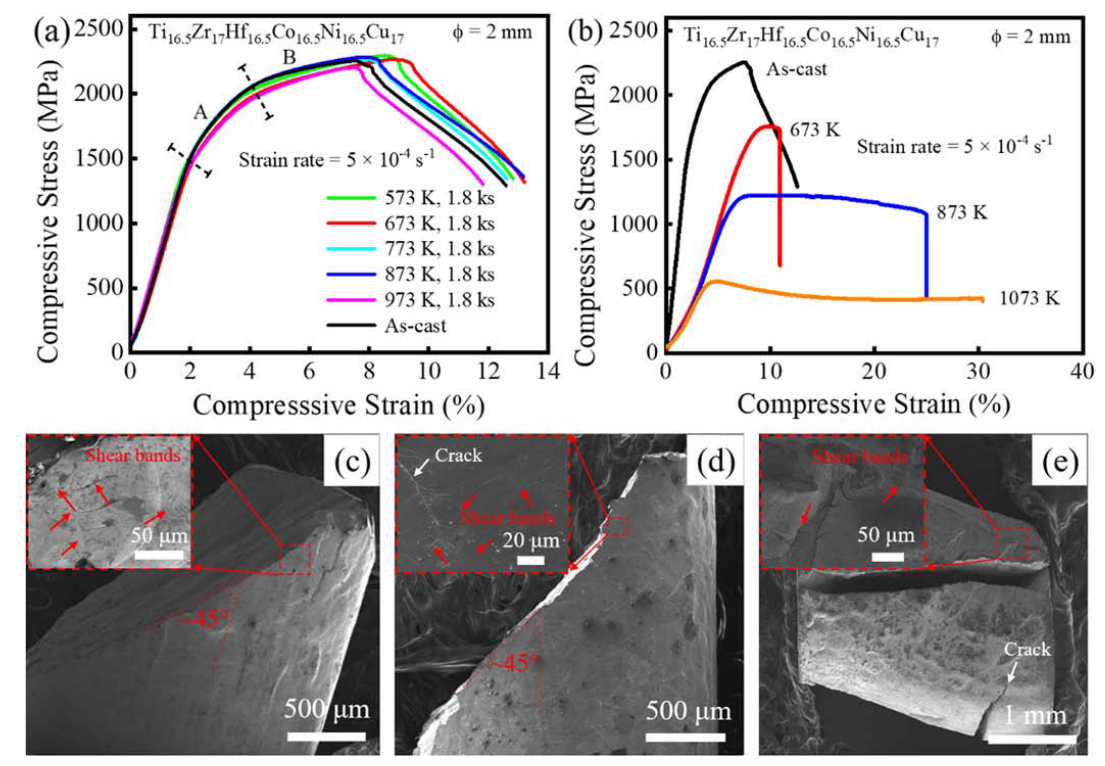
(a) Room-temperature compressive engineering stress-strain curves of the annealed Ti16.5Zr17Hf16.5Co16.5Ni16.5Cu17 alloy rods with a diameter of 2 mm under a strain rate of 5 × 10⁻⁴ s−1. (b) Compressive stress-strain curves of the alloy at elevated temperatures under a strain rate of 5 × 10⁻⁴ s−1. SEM images of the whole fracture surface with lateral edge parts just near the fracture surface (the insert images) of the alloy rods in as-cast (c), after annealing at 873 K for 1.8 ks (d) and in a deformed state at 873 K (e) with a strain rate of 5 × 10⁻⁴ s−1.
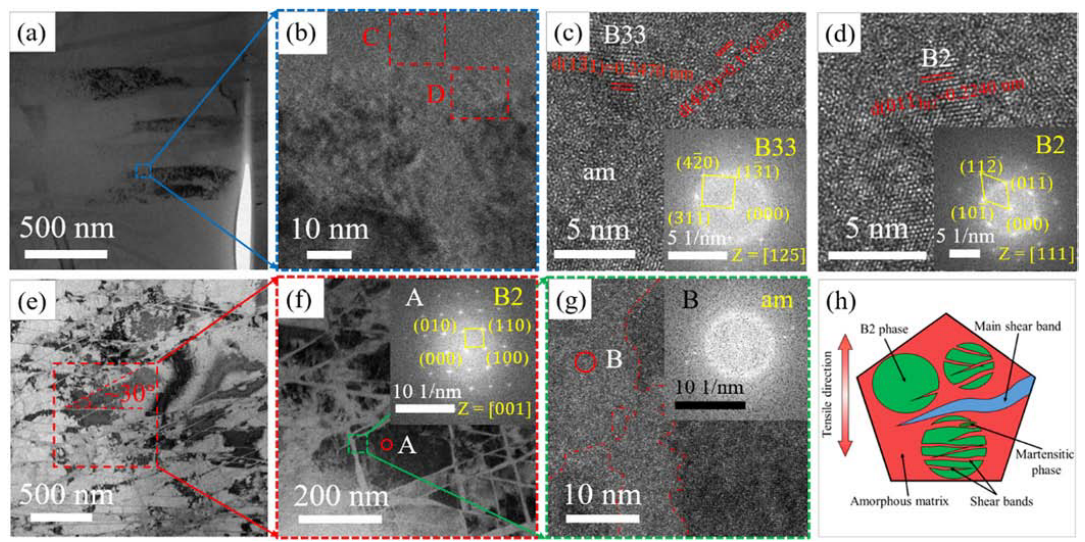
(a, e) Bright-field TEM images taken from the regions near the fracture edge of the as-spun Ti16.5Zr17Hf16.5Co16.5Ni16.5Cu17 ribbon with a thickness of 65 µm subjected to tensile fracture at a strain rate of 1 × 10⁻⁴ s−1. (b) Bright-field TEM image of the enlarged part of (a). (c, d) High-resolution TEM image and selected-area electron diffraction patterns of the regions C and D of (b). (f) Bright-field TEM image of the enlarged part of (e) and selected-area electron diffraction patterns of the region A. (g) High-resolution TEM image of the enlarged part of (f) and selected-area electron diffraction patterns of region B. (h) Schematic diagram illustrating the deformed microstructure in the B2 phase of the alloy ribbons.
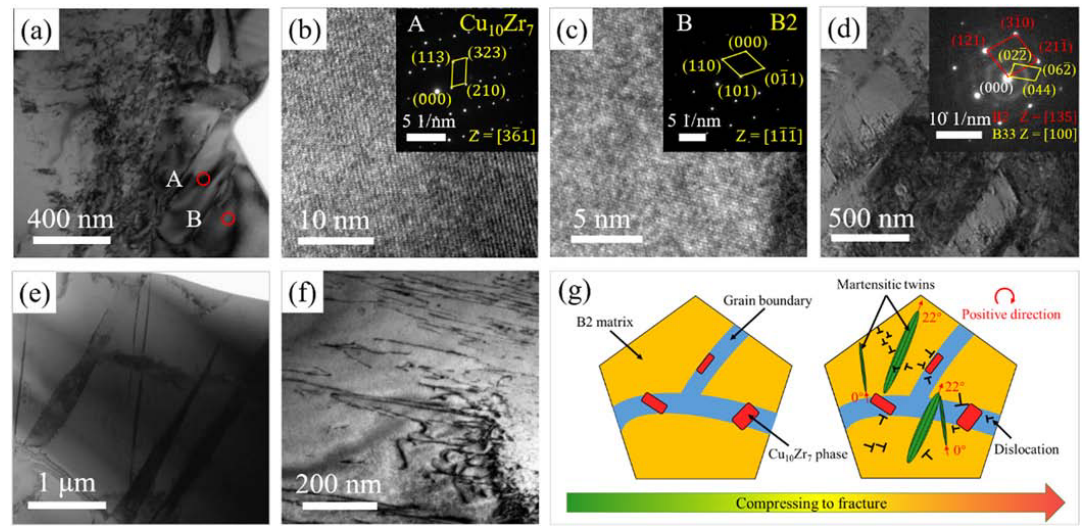
TEM bright-field images and selected-area electron diffraction patterns (a-f) of the second phase (b), matrix (c), martensitic twins (d, e), and dislocations (f), with diffraction patterns of the 2 mm Ti16.5Zr17Hf16.5Co16.5Ni16.5Cu17 alloy rod deformed to plastic strain over 5% at room temperature with a strain rate of 5 × 10⁻⁴ s−1. (g) Schematic diagram illustrating the deformation-induced microstructure change in the alloy rod.
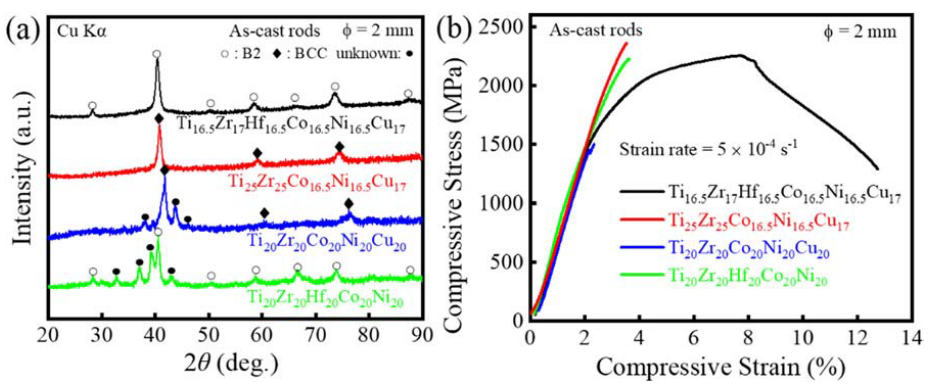
X-ray diffraction patterns (a) and compressive engineering stress-strain curves at room temperature (b) for the as-cast rods of Ti16.5Zr17Hf16.5Co16.5Ni16.5Cu17,Ti25Zr25Co16.5Ni16.5Cu17, Ti20Zr20Co20Ni20Cu20 and Ti20Zr20Hf20Co20Ni20 alloys.
